- Person developing code: Youssef Ragab, yragab@gwu.edu
- Model date: August 2021
- Model version: 1.0
- License: MIT
- Model implementation code: analytics_edge_project.ipynb
- Primary intended use: Project for GWU DNSC 6301 bootcamp, using decision trees to predict credit line delinquency and bias remediation for protected groups.
- Primary intended users: Students of GWU DNSC 6301 bootcamp
- Out of scope use cases: Any scope beyond educational is out of scope
- Data Dictionary
| Name | Modeling Role | Measurement | Level Description |
|---|---|---|---|
| ID | ID | int | unique row indentifier |
| LIMIT_BAL | input | float | amount of previously awarded credit |
| SEX | demographic information | int | 1 = male; 2 = female |
| RACE | demographic information | int | 1 = hispanic; 2 = black; 3 = white; 4 = asian |
| EDUCATION | demographic information | int | 1 = graduate school; 2 = university; 3 = high school; 4 = others |
| MARRIAGE | demographic information | int | 1 = married; 2 = single; 3 = others |
| AGE | demographic information | int | age in years |
| PAY_0, PAY_2 - PAY_6 | inputs | int | history of past payment; PAY_0 = the repayment status in September, 2005; PAY_2 = the repayment status in August, 2005; ...; PAY_6 = the repayment status in April, 2005. The measurement scale for the repayment status is: -1 = pay duly; 1 = payment delay for one month; 2 = payment delay for two months; ...; 8 = payment delay for eight months; 9 = payment delay for nine months and above |
| BILL_AMT1 - BILL_AMT6 | inputs | float | amount of bill statement; BILL_AMNT1 = amount of bill statement in September, 2005; BILL_AMT2 = amount of bill statement in August, 2005; ...; BILL_AMT6 = amount of bill statement in April, 2005 |
| PAY_AMT1 - PAY_AMT6 | inputs | float | amount of previous payment; PAY_AMT1 = amount paid in September, 2005; PAY_AMT2 = amount paid in August, 2005; ...; PAY_AMT6 = amount paid in April, 2005 |
| DELINQ_NEXT | target | int | whether a customer's next payment is delinquent (late), 1 = late; 0 = on-time |
- Data Source: GWU Blackboard, email professor Johnston Patrick Hall jphall@gwu.edu for more information
- The data was divided into 60% training, 20% validation, and 20% testing
- Number of rows in training and validation:
- 12,000 rows of training data
- 9,000 rows of validation data
- Source of test data: GWU Blackboard, email Professor Johnston Patrick hall, jphall@gwu.edu for more information
- Number of rows in test data: 9,000 rows
- Difference between testing and training data: None
- Columns used as input for final model:
- LIMIT_BAL
- PAY_0
- PAY_6
- BILL_AMT_1
- BILL_AMT_6
- PAY_AMT_1
- PAY_AMT_2
- PAY_AMT_3
- PAY_AMT_4
- PAY_AMT_5
- PAY_AMT_6
- Columns used as target variabels for final model
- DELINQ_NEXT
- Type of model: Decision Tree
- Software used to implement model: Python, Scikit-learn package
- Version of modeling software:
- Scikit-learn 0.24.2
- Python 3.8.3
- Hyperparameters of the model:
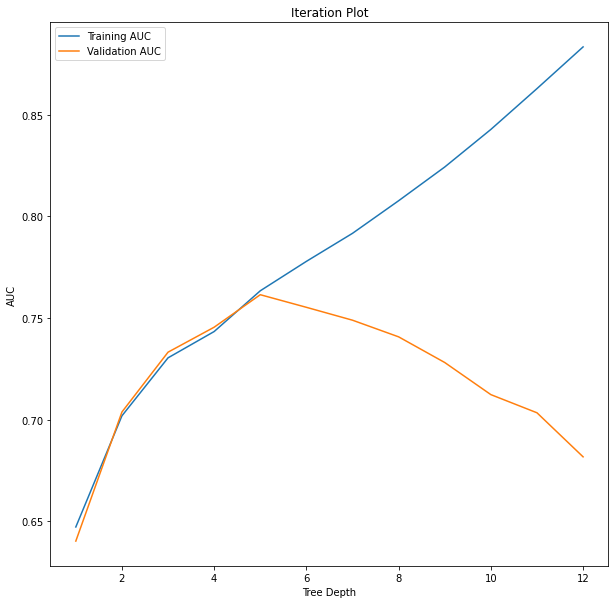
- Tree depth: 6
- Cross-validation folds: 5
- Metrics used to evaluate final model: AUC
- AUC for different subsets of data:
- Training: 0.88
- Testing: 0.75
- Validation: 0.68
- Visualizations:
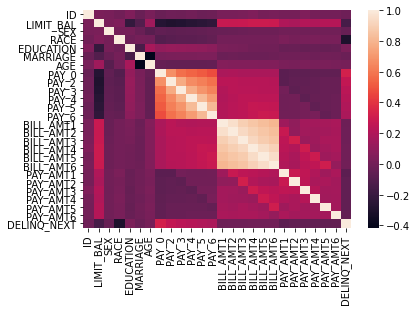
- Correlation Heatmap:
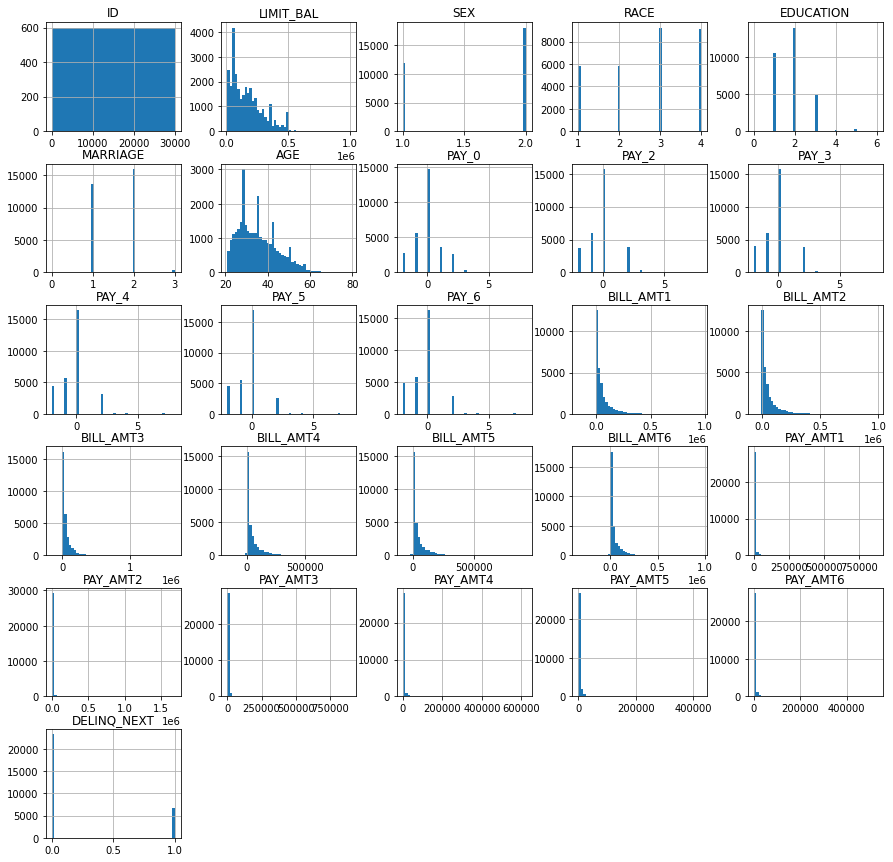
- Histograms:
- Iteration plot:
- Final Decision Tree:
- Correlation Heatmap:

- Potential negative impacts of using model:
- Math and software problems
- Decision trees are often far more complex than simple linear models and this using decision trees reduces the interpretability of the model
- Decision trees are also often very sensitive to small changes in the training data, meaning that we might get different results by using a different dataset or even a different random seed.
- Real world risks:
- This model uses very fine margins to approximate a probablity of delinquency in the next loan, using decision trees for a model this sensitive means that one small change in the data could swing the model either way. In the real world, this means that one candidate being late on one payment could impact their ability to get a loan even if the rest of their datapoints suggest that they are not going to default.
- The model does show adverse imapct, even though it is above the threshol of 80% percent that is widely used. This will negatively impact two protected groups (Black and Hispanic) when trying to get loans. Ideally the model would have parity between the protected and reference groups but we are not able to achieve that.
- Math and software problems
- Potenital uncertainties of using the model:
- Math and software probelms
- Data entry errors would negatively impact accuracy model.
- Outliers in the data would also negatively impact accuracy of the model.
- Real world uncertainties
- These math problems are especially true if these errors or outliers fall within the protected groups. This will decrease the adverse impact ratio which is already very close to the accepted percentage
- Math and software probelms
- Unexpected results: Two of the protected groups were favored when it comes to giving out loans (female, Asian).