Releases: wolfpld/tracy
Release list
Tracy Profiler 0.14


For a more detailed change list, see https://github.com/wolfpld/tracy/blob/v0.14.0/NEWS.
Automated capture
Added two new CLI tools: tracy-capture-daemon and tracy-merge. The daemon automatically discovers Tracy clients over UDP and captures each to its own file. The merge tool combines multi-process traces into one view.

In the current implementation, the merge tool preserves zones, messages, and plots only. GPU zones, memory events, and call stacks are lost.
Sections: mark program execution phases

Use the TracySectionEnter and TracySectionLeave macro pair to mark high-level phases of the application (e.g., game levels). Sections can overlap freely, may be assigned to user-defined categories for filtering, and can be used to set time range limits.

Zone call stack reconstruction
Tracy will now perform heuristic reconstruction of call stacks for zones captured without them (requires sampling to be enabled). Such call stacks are indicated with a magic-wand icon.

This, along with the "parent zones" list, replaces the previous "zone trace" functionality, which was too inconvenient to be useful.
Frame image playback improvements
The playback can now be looped, and the frame range can be limited either by setting the ranges manually or by copying the range from annotations/sections/time ranges.

Timeline UX

The sample markers on the timeline are now color coded. Green markers show that your code was executing. Blue markers indicate that execution was in an external library code. Red markers are for time spent in kernel.
The order of threads can now be sorted in the trace settings window.
In-profiler user manual
The embedded user manual, previously experimental, has received many improvements. The manual sections are now separated, with a tree navigation available. The rendering quality has been vastly improved. The cross-section navigation links are now working as intended.

Data consistency
It's a bit embarrassing, but previously the timing data displayed in the sampling statistics window, in the sample entry stacks window, and in the symbol view window didn't really match, with each window having its own opinion on how the time should be calculated. This has been fixed, and now each window displays matching time data.

The sample entry stacks window now has a control for what should be counted. The modes of operation are: count the symbol if it was executing (on top of stack), which was the only option available previously. The two new options are to count if the symbol was reached somewhere on the stack (i.e., also count if the symbol made a function call), either skipping or including recursion.

Flame graph improvements
The sampling flame graph no longer skips unknown symbols, which are crucial in understanding what the program does. These frames are now aggregated by the executable image name.

It is now possible to group sampling flame graph entries by name instead of the symbol address. A practical example of when this could happen would be inline expansion of the same function at multiple call sites within the enclosing symbol.

The flame graph can now be zoomed and panned with the mouse.
flame3.mp4
Frame statistics
The frame statistics view, previously available in the Trace Info window, has been moved to its own window. There's now a full array of statistical data displayed. The frame range can now be narrowed down not only to the timeline view, but also to a specific time range, matching other places in the profiler where you can limit time range.

Compare traces improvements
The comparison between two traces now has full statistical parity with the Find Zone window (including the newly added coefficient of variation), in both the Zone and Frames comparison modes. The more/less markers are now color-coded to indicate the amount of change, with greater disparity making the color of the text more saturated to show importance.

It is now possible to limit time ranges in the two compared traces using either the newly added sections feature, or manually created annotations.

Call stack window improvements
The external frames are now hidden by default (except in the wait stacks) and are dimmed when they are turned on. The originating thread is now displayed in the window. Optional LLM description of the call stack can be generated either manually or automatically.

Call stacks are now also displayed in various tooltips.

Settings sidecar overhaul
Handling of trace-specific settings was reworked. Now, everything is stored in a single file. By default, this file is still stored deep in the profiler configuration directory, but the configuration sidecar can now be made public in the Trace Information window.

This will move the settings file to the directory where the trace is stored. Both files can then be easily copied to another machine.

Bonus feature: it is now possible to generate a random trace name.
Symbol view improvements
The child call list can now be resized.
symbolchildren.mp4
The child-call time percentage is now shown as a percentage of calls (as it was before), and also as a percentage of total symbol time.
Display of the HW sample statistics is now disabled by default.
Message window improvements
Added support for setting message's source and severity with the TracyLogString macro.

Multi-line messages are now properly trimmed to a single line on the list, with full message content available in the tooltip.
Added context menu for each message, with an option to copy to clipboard.
Visible threads list UX
The list of visible threads in various windows is now a scrollable multi-column view.

Annotations improvements
Improved the way annotations are rendered on the timeline. Annotations can be hidden.

Newly created annotations are assigned a randomly generated nonsense name.
Tracy Assist
The LLM assistant integration has been vastly improved, bringing support for modern llama.cpp model integration and protocol. This rework makes small (4B) models usable for simple tasks; the time on the screenshot below is for pure on-CPU calculation.

Tracy exposes data it captured to the LLM, which allows it to perform analysis of the code. Here we have a crash call stack that was intercepted by Tracy:

This call stack can be attached to the chat with the assistant by clicking on the robot icon. Better yet, open the context menu of that icon and choose one of the preset queries. Tracy will even suggest the next question you may want to ask! The screenshot below shows a 31B model ...
Tracy Profiler 0.13.1
- Fixed parsing of extended model and family of x86 CPUID.
- Fixed memory corruption when a "long" user name was used on Android.
- Fixed wrong function signature when
TRACY_DEBUGINFODwas enabled. - Mount list is now read using proper API instead of processing
/proc/mounts. - Fixed shadow warning supression not being enabled on gcc.
- Silently ignore lost ETW Vsync events instead of asserting.
- Worked around few cases where old macOS machines do not support C++20 properly. Thanks Tim Apple!
- Added truncated mean parameter to csvexport.
- Added experimental viewer for the user manual.
- Memory free faults can be now ignored with the
TRACY_IGNORE_MEMORY_FAULTSoption. - Fixed race condition during profiler shutdown.
Tracy Profiler 0.13
For a more detailed change list, see https://github.com/wolfpld/tracy/blob/v0.13.0/NEWS.
LLM integration
Why did you—

You can now use GenAI features to get help using the profiler or analyzing the code you're profiling.
The automated assistant can search the user manual to answer your questions about the profiler. It can also read the source code when you ask about program performance or algorithms. It has the capacity for access to Wikipedia, the ability to search the web, and the capability to access web pages in response to general questions.

Note that a considerable amount of local setup is required to get it working. The only way to access the assistant is to run everything locally on your system. This ensures that everything you do stays private and that you won't be subject to forced changes in features or terms and conditions. Consult the user manual (section 5.25) for the instructions.
Will the computer always give me the correct answers?
Yes. If you open the user manual PDF, the computer will give you the correct answers. But that's a long text, and you need to read it, and think about it, and that's boring, and the head starts to hurt. It's more fun to talk with the computer like with a human.
Now, if you have ever talked with a human, you may have noticed that humans do in fact guess the things they do not remember, make up things they do not know, constantly steer the conversation into strange directions, and generally don't like to admit they may be wrong. The AI is very good at simulating human behavior.
Save defaults in options window
Default values for certain settings can be now saved in the options window.

Thread cropper
The display height of any timeline thread can be limited with a thread cropper widget at the left border of the screen.

Additional platform support
- Microsoft Game Development Kit (GDK)
- AMD ROCm / Rocprof
Tracy Profiler 0.12.2
- Fixed builds made out of git checkout directory.
- Added range limits for flame graph.
- Fixed wayland include paths for distros that use non-standard package layouts.
- Workarounded MinGW build problems. Safe symbol retrieval is not available on this platform.
- Fixed Lua bindings when TRACY_NO_CALLSTACK is defined.
Tracy Profiler 0.12.1
- Fixed window size calculation on macOS, most notably enabling the vertical timeline scroll bar.
- Made debug builds of the GUI profiler work with broken Apple compiler.
- Fixed profiler compilation when build directory is outside the source directory.
- Set proper include path when using CMake integration.
- Added the Tracy Metal and CUDA headers to CMake install configuration.
- Documented flame graphs.
Tracy Profiler 0.12
For a more detailed change list, see https://github.com/wolfpld/tracy/blob/v0.12.0/NEWS.
CPU topology includes die
To enable better insight into potential performance pitfalls the profiler will now show the CPU die topology. Examples include the chiplets on AMD Ryzen CPUs.

Flame graph
The aggregated performance data can be now viewed on a flame graph. Note that there is no zoom functionality in this graph.
Instrumentation:

Sampling:

Visible git ref in UI
The git ref the profiler was built from is now displayed in the about dialog. You can use it to make sure your application uses the same version of the profiler as the server.

Enhanced GPU profiling
Metal and CUDA are now supported.
Top inlines
The sampling statistics view can now display the top inline in each symbol to make it more explicit where most of the time is actually spent.
Previous behavior:

Top inline enabled:

More clear way to open disassembly view
The symbol disassembly view was previously a bit hidden. The new popup when clicking on an item in the sample statistics view brings it more to the front row.

Wall clock time of zones
The zone info window now shows the wall clock time of when the zone was executing. This can be useful if you need to correlate the profile capture with external tools such as Wireshark.

Thread wakeup visualization
Tracy now visualizes thread wakeup reasons.

Tracy Profiler 0.11.1
- Utilities import-chrome and import-fuchsia now live together in the import directory.
- Added TRACY_VERBOSE to available CMake options.
- It is now possible to set TRACY_SAMPLING_HZ via a environment variable.
- Thread group hints can be now used to group threads together in the profiler UI.
- Limit Lua file names to 255 characters, as the source string can contain the whole script, if loaded with loadstring().
Tracy Profiler 0.11
For a more detailed change list, see https://github.com/wolfpld/tracy/blob/v0.11.0/NEWS.
CMake migration
The old server-side build system has been replaced by CMake. The client integration is not affected. Refer to the manual for details.
Most importantly, a known version of the capstone library is now downloaded from GitHub. You will need to have git installed for this to work (there is a CMake option to use the capstone installed on the system, as was done previously).

User text formatting
ZoneText and ZoneName macros now have a printf-like variant, denoted with a F postfix.
Added "Hide external code" option to call stacks
Before:

After:

Aggregation of inline functions
Symbol statistics window now allows aggregation of inlined functions in symbols.
Before:

After:

Relative costs of inline functions
Cost measurements of inlined functions in the symbol statistics window can be now relative to the base symbol instead of total program run time.
After (compare to above images):

Assembly instruction cost
The per-line sampling statistics are now also displayed as a percentage of total program run time.

Linux kernel code
Kernel symbol code retrieval is now also available on Linux.

Faster and smaller trace files
Added support for multiple compression streams in trace files. This effectively parallelizes both load and save operations.
The default save setup is now set to Zstd level 3 with 4 compression streams. This gives both faster compression time and smaller file size.

Tutorial system
New users will be now eased into the profiler with a set of tutorial achievements.

Python bindings
Support for Python integration has been added.
Wayland improvements
To build the profiler GUI with Wayland you now need wayland-scanner and wayland-protocols to be installed. A reasonably recent release of the protocols is required. Fractional DPI scaling is now properly supported on Wayland.
Offline symbol resolution
By default, Tracy does symbol resolution during the capture. This can be slow in some circumstances.
Clients built with TRACY_SYMBOL_OFFLINE_RESOLVE option won't perform live symbol resolution. In such case, the symbol data can be added at a later time, with the update utility.
Fuzzy matching symbol data for source view
Opening the source code view that has no associated address in code (i.e., from the list of instrumented zones, or from the find zone window) will now search the list of symbols for a function name match. In many cases this will result in displaying the full disassembly view where previously you would only see the source code.
Matching is performed by string comparisons, which in rare cases may result in showing false data. Press ctrl key while opening source view to keep the old behavior.
If more than one matching symbol is found (e.g., if two classes have methods with the same name, or if a template is instantiated in multiple places in code), it is not possible to tell which of the code locations the source location corresponds to and only the source code will be displayed.
Meson integration breaking changes
The tracy_shared_libs Meson option was removed. Use interface provided by Meson to set the library type instead.
Dropped the tracy_ prefix from Meson options. The tracy_enable option remains as it was, as it can be inherited from parent projects.

C API breaking changes
ScopedZone and AllocSourceLocation now accept color parameter. Impact on existing code should be minimal.
AllocSourceLocation has a new parameter with a default value.
__tracy_alloc_srcloc and __tracy_alloc_srcloc_name break the existing API. This can be easily fixed by setting the last parameter to zero.
GPU resynchronization
It is now possible to resynchronize the CPU and GPU timers, if you are not able to use a calibrated context. This is not exposed as an easy-to-use API and generally should be avoided. Use at your own risk.
Fuchsia import
A new utility, import-fuchsia has been added to import data from the Fuchsia trace format.
QNX
Basic support for QNX has been added.
Tracy Profiler 0.10
For a more detailed change list, see https://github.com/wolfpld/tracy/blob/v0.10/NEWS.
System power usage
Under Linux, Tracy will now report how much power the system is using. The specifics of what is measured depends on what the hardware is capable of reporting.

Error markers removal
Zone error markers (red regions and error bars) have been removed to be consistent with how all other profiling events are displayed.

Major overhaul of how timeline items are processed in GUI
See https://wolf.nereid.pl/posts/how-tracy-faster/ if you are interested in more details.
Global configuration settings dialog
You can find it in the profiler's about menu (the wrench icon in the welcome dialog).

Trace description or filename is now displayed on the window title bar

History of viewed symbols
You can go back to previously displayed symbols in the symbol view. Currently the history granularity is at the symbol level.

Improvements in csvexport
You can now export messages and thread identifiers of zones.
GPU tracing improvements
Vulkan contexts can now use the VK_EXT_host_query_reset extension and Vulkan symbols can be dynamically loaded. The D3D11 and D3D12 instrumentation has been rewritten.
Support for running under rr
If you need to run a profiled application under the rr debugger, you can now use the TRACY_PATCHABLE_NOPSLEDS to make the instrumentation more efficient.
Custom program name support
You can now use the TracySetProgramName() macro to set a custom program name to be sent by the client. You may find this useful if you need to run the same executable in different roles, e.g. one executable would identify itself as a game server, the other as a game client, and so on.
Tracy Profiler 0.9.1
For a more detailed change list, see https://github.com/wolfpld/tracy/blob/v0.9.1/NEWS.
Source diff when comparing traces
Compare traces menu can now display source code differences between two traces.

Improvements to assembly listings
Listings are now annotated with source line information. To improve compatibility with external tools comments are now prefixed with '#' instead of ';'.

Histogram tooltip will now also show left/right counts.

Timeline handling improvements
Tracy now actively manages timeline vertical scroll offset in order to keep the thread under the mouse cursor in the same place on screen.
See the following video:
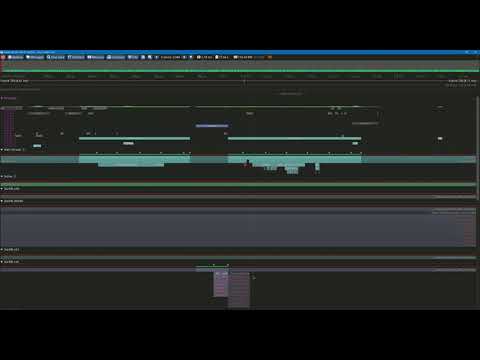
Jump and call target queries
Tracy will now query jump and call target addresses. This enables discovery of target function names, even if such function has no samples and is not present in any call stack.
Instead of call 0x7ff61a5380c0 you will now more often see the following:

Native Wayland support
Tracy on Linux now targets and requires Wayland by default. Other platforms still use GLFW.
Pass LEGACY=1 parameter to make, if you want to instead rely on the GLFW library, like before.
Please don't ask about window decorations on Gnome. Current behavior is the intended behavior. Gnome does not want windows to have decorations, and Tracy respects this choice. If you find this problematic, use a desktop environment that actually listens to its users.
Privilege warning
Added warning when the profiler interface is run with privilege elevation. Advice is given to instead run the client with admin rights.
