Conversation
CHANGELOG.md
Outdated
| ### Features | ||
| 1. [#2083](https://github.com/influxdata/chronograf/pull/2083): Every dashboard can now have its own time range | ||
| 1. [#2045](https://github.com/influxdata/chronograf/pull/2045): Add CSV download option in dashboard cells | ||
| 1. [#2127](https://github.com/influxdata/chronograf/pull/2127): Add CSV download option in dashboard cells |
There was a problem hiding this comment.
Looks like the changelog editing stomped other changes?
|
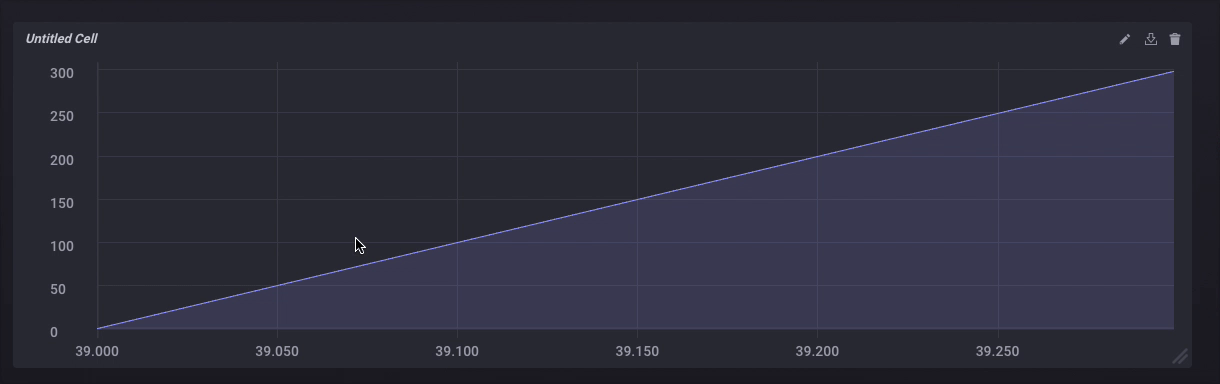
This does the thing! These points are all over the 39th second:
|
 121watts
left a comment
121watts
left a comment
There was a problem hiding this comment.
I pulled it down and tested it out. LGTM 😄
| ### UI Improvements | ||
| 1. [#2111](https://github.com/influxdata/chronograf/pull/2111): Increase size of Cell Editor query tabs to reveal more of their query strings | ||
| 1. [#2119](https://github.com/influxdata/chronograf/pull/2119): Add cancel button to Tickscript editor | ||
| 1. [#2119](https://github.com/influxdata/chronograf/pull/2119): Add support for graph zooming and point display on the millisecond-level |
There was a problem hiding this comment.
I think this clobbered the changelog
There was a problem hiding this comment.
Good catch, Chris. Fixing in master.
|
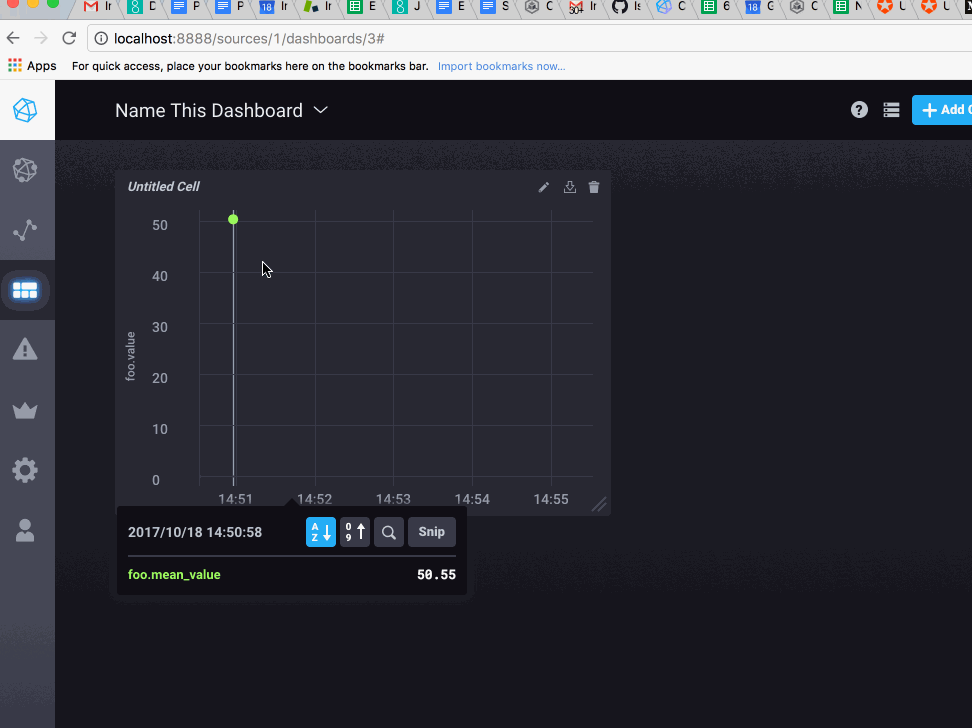
@cryptoquick couple of issues, when you zoom in and you don't select a full set of data the graph shows no results (which it shouldn't). Also when you get into this state you can no switch time range via the drop down, e.g. try to switch it to past 15 min.
|
|
@nhaugo I can only replicate this if I'm using the date picker. If I use 'fixed' query like this in a cell, I can't replicate it: |
Connect #1449
The problem
Chronograf graphs in UI wouldn't label millisecond or sub-millisecond axes.
The Solution
Fork Dygraphs to our own company GItHub account and apply changes from danvk/dygraphs#777, and then point our project use that repository.