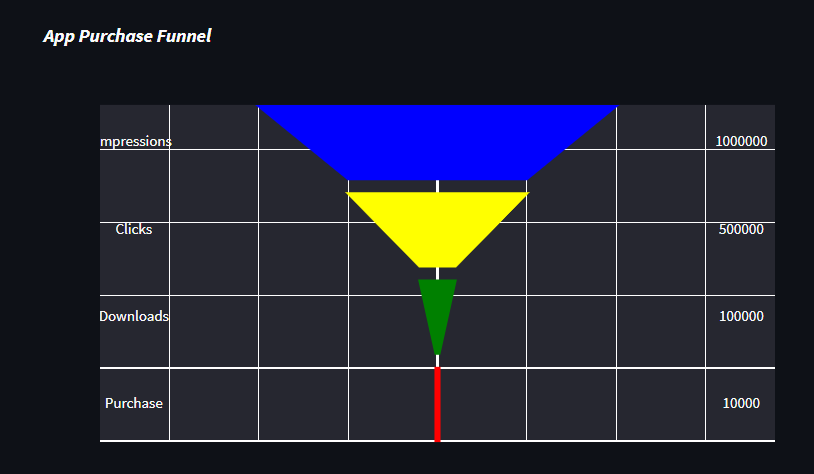
Deploy-Funnel-Chart-with-Streamlit Link Funnel charts are often used to represent data in different stages of a business process. It’s an important mechanism in Business Intelligence to identify potential problem areas of a process. For example, it’s used to observe the revenue or loss in a sales process for each stage. A funnel chart has multiple phases and values associated with them. Here is a table that represents a user flow funnel for a app. The column named 'Values' represents the total number of users at that Phase. phases values Impressions 1000000 Clicks 500000 Downloads 100000 Purchase 10000