Tutorials and a complete example catalog for Pts 1.0.2. For class and method details, see the complete API reference.
Demo and study source files are linked directly from ptsjs.org instead of embedded, so agents can fetch only the examples they need.
canvasform.compositecanvasform.gradientcanvasform.textBoxcanvasspace.actioncanvasspace.resizecircle.intersectCircle2Dcircle.intersectLine2Dcircle.withinBoundcolor.HSLtoRGBcolor.LABtoRGBcreate.delaunaycreate.flockcreate.gridcellscreate.noisePtscreate.samplingcurve.beziercurve.bsplinecurve.cardinalgeom.interpolategeom.perpendicularimg.patternimg.pixelline.collinearline.intersectLine2Dline.perpendicularFromPtpath.cropphysics.particlesphysics.shapespolygon.convexHullpolygon.kochpt.extendspt.unitpts.quickStartshaping.linearsound.analyzesound.freqDomainsound.playsound.timeDomainsvgspace.getFormtemplatetriangle.incircleui.track
guide.canvas_aligntextguide.canvas_paragraphboxguide.canvas_paragraphbox2guide.canvas_textboxguide.getting_started_1guide.getting_started_2guide.getting_started_3guide.getting_started_4guide.getting_started_5guide.getting_startedguide.group_opguide.group_segmentsguide.image_cropguide.image_editguide.image_loadguide.image_load2guide.image_patternguide.image_pattern2guide.image_pixelguide.op_bspline_2guide.op_bsplineguide.op_closest_2guide.op_closestguide.op_intersectguide.op_perpendicularguide.pt_angleguide.pt_createguide.pt_opguide.pt_reflectguide.sound_frequencyguide.sound_micguide.sound_simpleguide.sound_timeguide.sound_visualguide.space_formguide.templateguide.tempo_controlguide.tempo_progressguide.tempo_rhythmguide.tempo_shapingguide.tempo_stagger
CanvasForm.fontCanvasForm.imageCanvasSpace.offscreenCircle.intersect2DColor.hsbColor.hslColor.labColor.lchCreate.gridCellsCurve.bsplineCurve.interpolateGeom.sortEdgesImg.loadLine.intersect2DLine.markerPath.cropPath.dividePath.excludePath.intersectPath.minusBackPath.minusFrontPath.unitePolygon.bisectorPolygon.convexHullPolygon.intersectPolygon.midpointsPolygon.toRectsPt.opRectangle.intersect2DRectangle.quadrantsStudy.templateTriangle.centers
It's easy to get started with Pts. Here we'll review the core concepts and build a fun thing together. Let's do this!
Interactive example:
guide.getting_started· open live
Here's a spoiler of what we will build. Touch to play it, and take a look at the source code. The core code is only ~10 lines long.
Pts is built upon the abstractions of Space, Form, and Point. If that's too abstract, you can think of it like drawing: Space represents a piece of paper, Form represents a pencil, and Points represent an idea — and you connect the dots.
Given an idea, you may express it in different forms in different spaces. Would it be expressed in pixels or LEDs? Is it visible or audible? Does it look like abstract art or ASCII art? As Pts develops, it will offer more Spaces and Forms that enable you to experiment with different ideas and their different expressions.
But enough of abstractions for now. Let's see how it works in a concrete example. In the following sections, we will create a quick sketch step-by-step and discuss the main features of Pts.
You may also be interested in this article which discusses the concepts of Space, Form, and Point.
(If you don't know how npm works, it's not a problem. Skip to next section to use Pts as a script directly.)
If you use npm, first npm install pts (or pnpm add pts) and then import the classes you need:
import {CanvasSpace, Pt, Group} from "pts"
To use Pts in React, take a look at react-pts-canvas in the Ecosystem guide.
Pts targets ES2015 and does not ship a separate ES5 build. If your application needs an older JavaScript target, configure your bundler to transpile Pts and provide the platform polyfills your application requires. Keep importing from "pts".
First get pts.js or pts.min.js. You may get a direct link from a CDN service (eg, unpkg or jsDelivr), or download it from the github repo. Include it in your html, and then create another js file for your script and add it too.
<script src="https://cdn.jsdelivr.net/npm/pts/dist/pts.min.js"></script>
<script src="path/to/my_script.js"></script>
When using as a script, we usually start by adding Pts into the global scope first.
Pts.namespace( window );
That means we can call all Pts classes like Group directly, instead of Pts.Group which is a bit clumsy to write.
Note that if you're using Pts.quickStart, there's no need to call Pts.namespace again. See below for details.
The online editor enables you to quickly experiment with Pts and download your code to run locally too. Try the editor here.
Now that we've learned how to run Pts in various ways, it's time to start using it!
Pts provides a CanvasSpace which enables you to use html <canvas> as a space. You can create a CanvasSpace like this:
var space = new CanvasSpace("#hello");
space.setup({ bgcolor: "#fff" });
This assumes you have an element with id="hello" in your html. If your element is <canvas id="hello">, CanvasSpace will target that canvas. Otherwise if your element is a container like <div id="hello">, a new canvas will be created and appended into it. You may also pass an HTMLElement instance directly into CanvasSpace.
The setup function allows you to initiate the space with an object that specifies some setup options, like background-color and auto-resize.
Next, you can get the default CanvasForm which, as we mentioned before, provides the "pencils". CanvasForm helps you draw lines, circles, curves and more on the html canvas.
var form = space.getForm();
Do you know you can create your own forms by extending CanvasForm or Form class? It's like making your own pencils. You can initiate your custom form like this:
// Initiate your own BeautifulForm class
var form = new BeautifulForm( space );
For quick prototyping, you can use the quickStart function to create CanvasSpace and CanvasForm directly. This will create two global variables called space and form, and the function also returns an animate function for you to use. You can do all these in just one line of code:
var run = Pts.quickStart( "#hello", "#fff" );

// quickStart returns a function wrapper for use in animation loop, eg:
run( function(time, ftime) { ... } );
Now we have paper and pencil. What should we draw?
The space, which we have created, contains some handy variables. For example, the pointer variable tells us the current position of pointer in space (ie, mouse or touch position). Let's use it to draw a point.
To render an animation continuously, we need to add a "player" to the space. A "player" can be a callback function to run your animation, or an object that specifies functions for start, animate, and action. You may add multiple players to a space.
At its simplest form, this is how we can draw the pointer.
space.add( () => form.point( space.pointer, 10 ) );
And here's the result. Touch the demo and move around.
Interactive example:
guide.getting_started_1· open live
Try editing live code of the above demo. The source code also demonstrates different options of initiating a Pts canvas.
So first we add a "player" as a function to space, and in that function, we use form to draw space.pointer with radius of 10. By default, the point is drawn as a square with red fill-color and white stroke-color.
The animate callback function actually provides 2 parameters: time which gives the current running time, and ftime which gives the time taken to render a frame.
Let's modify the code above to make the circle pulsate.
space.add( (time, ftime) => {
  let radius = Num.cycle( (time%1000)/1000 ) * 20;
  form.fill("#09f").point( space.pointer, radius, "circle" );
});
Interactive example:
guide.getting_started_2· open live
Success! The calculation (time%1000)/1000 maps the running time to a value between 0 to 1 every second. Then we use the Num.cycle function to make the value cycle between 0...1...0...1, and we multiply the value by 20 to get the radius. Finally, we draw the pointer with the radius as a blue circle. Pretty easy, right?
There are 3 basic structures in Pts
- a Pt which is an array of numbers (1D tensor)
- a Group which is an array of Pts (2D tensor)
- an array of Groups (3D tensor)
Pts provides many classes to work with these structures. For example, a rectangular boundary can be defined by two Pts -- one at top-left and one at bottom-right, and you can also get a Group of 4 Pts from its 4 corners.
Let's make this easier to understand with an example:
var rect = Rectangle.fromCenter( space.center, space.size.$divide(2) );
var poly = Rectangle.corners( rect );
poly.shear2D( Num.cycle( time%5000/5000 ) - 0.5, space.center );

form.fillOnly("#123").polygon( poly );
form.strokeOnly("#fff", 3).rect( rect );
Interactive example:
guide.getting_started_3· open live
What's happening in these 5 lines of code? Let's find out.
The first line create a "rectangle" from a center point, and we specify that the center is space's center and the size is space's half-size. ($divide is a Pt function that calculates division and returns a new Pt.) The variable rect stores a Group of 2 Pts — its top-left and bottom-right positions.
The second line takes rect and get its corners. So the variable poly contains a Group of 4 Pts.
The third line use the Group's shear2D function to shear the polygon at space's center. The amount of shearing cycles between -0.5 to 0.5 every 5 seconds.
The 4th and 5th line just draw the rectangle and the sheared polygon.
Even though it takes words to explain, the code is actually quite simple :)
From here on, it's up to you. Squint your eyes and see what shapes and structures hide between those invisible points, or what motions and interactions could generate unique and expressive forms.
For example, what if we take two corners of the rectangle, and join them with the pointer to draw a triangle?
Interactive example:
guide.getting_started_4· open live
And what if we also draw the inner circle of each triangle?
Interactive example:
guide.getting_started_5· open live
This is what you can do with pts in ~15 lines of code.
// setup
Pts.namespace(this);
var space = new CanvasSpace("#hello").setup({ bgcolor: "#fff" });
var form = space.getForm();

// animation
space.add( (time, ftime) => {

  // rectangle
  var rect = Rectangle.fromCenter( space.center, space.size.$divide(2) );
  var poly = Rectangle.corners( rect );
  poly.shear2D( Num.cycle( time%5000/5000 ) - 0.5, space.center );

  // triangle
  var tris = poly.segments( 2, 1, true );
  tris.map( (t) => t.push( space.pointer ) );

  // circle
  var circles = tris.map( (t) => Triangle.incircle( t ) ).filter( Boolean );

  // drawing
  form.fillOnly("#123").polygon( poly );
  form.fill("#f03").circles( circles );
  form.strokeOnly("#fff", 3 ).polygons( tris );
  form.fill("#123").point( space.pointer, 5 );

});

space.play().bindMouse();
Also take a look at the alternative quick start mode example in the live editor. Give it a try!
Hope this gives you a quick and enjoyable walk-through. But wait, there's more: Take a look at the other guides which will explain Pts features in details.
We appreciate your feedbacks and bug reports. Please file an issue at github or ping @williamngan on twitter.
Enjoy and have fun!
A Pt represents a point in space, or more technically, an n-dimensional vector. You may also think of a Pt as an array of numeric values, a set of weights, or an arrow coming from the origin point (0,0,0...).
You can create a Pt in many different ways:
// defaults to (0,0)
new Pt()

// from a series of parameters, array, or object
new Pt( 1, 2, 3, 4 )
new Pt( [1,2,3] )
new Pt( {x:0, y:1, z:2, w:3} )
new Pt( anotherPt )

Pt.make( 5, 0 ) // same as new Pt(0,0,0,0,0)
Here's a simple demo visualizing a Pt, which moves with your mouse/touch.
Interactive example:
guide.pt_create· open live
Here the blue dot is the last position of your mouse/touch as a Pt. The black lines are the distances from the origin (top-left corner), which is equivalent to the Pt's position. The blue line represents another way to think of this Pt -- as a vector, as an arrow from the origin of this space.
Since Pt is a subclass of javascript's Float32Array, it means you may use all the Float32Array features on a Pt too. For example:
p[0]
p.fill( 0, 1, 2 )
p.reduce( (a,b) => Math.max(a,b), 0 );
Note that Float32Array doesn't allow some common Array functions like push() and pop() . If you need to grow or shrink the Pt's dimensions, either create a new one or use $concat and $take.
You can update a Pt's values by using to function, or accessing the .x, .y, .z, .w properties.
p.to( 1, 2, 3 )
p.to( anotherPt )
p.w = p.x + p.z
Pt provides basic functions for calculating vectors and matrices. But don't worry if you are not familiar with linear algebra. To start, think of it as methods to do calculations on arrays of values, like adding or multiplying them.
let pt = new Pt( 10, 10 )
pt.add( 1, 2 ) // pt is now (11, 12)
pt.divide( 2 ) // divide each value by 2
pt.multiply( {x: 2, y: 1} )
pt.subtract( anotherPt ).multiply( 5 ).add( [1,2,3] )
The above functions like add will update the values of pt instance. If you want to get the results as a new Pt, use $add instead. If a function's name starts with $, it indicates that its return value will be a new Pt.
let p1 = pt.$add( 1,2,3 );
let p2 = pt.$multiply( 5 ).add( 1,2,3 )
There are other basic vector operations like unit (get a normalized vector), magnitude (get its distance from origin), dot (find dot product), $project (find its projection vector). Check the docs on Pt for a full list.
Since a Pt can be thought of as an arrow from origin, you can find its angle with angle function. You can also find the angle between two Pts with angleBetween function. A related function toAngle lets you move a Pt by specifying a target angle.
pt.angle()
pt.angle(Const.yz) // get the angle of axis y-z
pt.angleBetween( anotherPt )
pt.toAngle( Math.PI/2 )
* Note that all angles are specified in radian, where 180 degrees = π radian. (Imagine half-circle is like 180 degrees.) You can use Geom.toRadian and Geom.toDegree functions to convert between degrees and radian.
Interactive example:
guide.pt_angle· open live
If you have used Illustrator or other graphics software before, you probably know the operations to rotate or scale a shape. Pt also provides these transformation functions:
pt.scale( 0.5 )
pt.rotate2D( Math.PI/3 )
pt.shear2D( [0.3, 1.2] )
pt.reflect2D( [p1, p2] )
If you want to transform from a specific anchor point instead of at (0,0), provide an anchor as the second parameter:
pt.scale( 0.5, anchorPt )
pt.rotate2D( Math.PI/3, anchorPt )
Take a look at the Geom class which also provides many functions to help with geometry and transformations.
Interactive example:
guide.pt_reflect· open live
A demo of scale and reflect transformation. The blue line's length changes the scale, while its angle specifies the reflection. Take a look at the source code to see how easy this is :)
You may use all of Float32Array's functions (eg, slice, map) with Pt. Some additional ones in Pt like $concat, $take make it simpler to work with TypedArray. Take a look at "Op" section to see how you can write your own functions to work with Pt easily.
// Use $concat and $take to grow and shrink a TypedArray
let p1 = new Pt(1, 2, 3).$concat( 4, 5 ); // becomes Pt(1,2,3,4,5)

// Use op -- see how it works in Op section
p1.op( Line.collinear );
Creating and cloning
new Pt()
new Pt( 1, 2, 3, 4 )
new Pt( [1,2,3] )
new Pt( {x:0, y:1, z:2, w:3} )
new Pt( anotherPt )
Pt.make( 5, 0 ) // same as new Pt(0,0,0,0,0)
pt.clone()
Getting and setting values
p[1]
p[2] = p[0]
p.x = p.y+1
p.to( 1, 2, 3 )
p.id = "p01"
Calculating
p.equals( p2, 0.00001 )
p.$ceil().floor().round()
p.abs()
p.maxValue() - p.minValue()
p.$min( p2 ).$max( p3 )
Vector math
p.add( 1,2 ).subtract( p2 ).multiply( 10 ).divide( 2 )
p.$add( 1,2 ) // $-prefix means getting result as a new Pt
p.angle()
p.angleBetween( p2 )
p.dot( p2 )
p.$cross( p2 )
p.$project( p2 )
p.magnitude()
p.magnitudeSq() // magnitude squared
p.unit() // unit vector
Transforming
p.scale(0.5).rotate2D( Const.half_pi )
p.shear2D( 0.2 ).reflect2D( line )
p.toAngle( Math.PI/3, 100 )
Working with array values
p.reduce( (a,b) => Math.max(a,b), 0 ) // can use all Float32Array functions
p.$take("xz")
p.$concat( 10, 100 )
p.toArray() // convert Float32Array to Array
Check out the full documentation too.
A Group represents an array of Pt. It is an abstraction that can fit many contexts. For example, you may use it to define a matrix, store a polygon, or interpolate a curve where each Pt is an anchor point.
In fact, a wide range of complex forms and ideas can be represented as one of these simple structures:
- a Pt which is an array of numbers
- a Group which is an array of Pts
- an array of Groups
The goal of pts.js is to help you see and express these structures in creative ways.
Group is a subclass of javascript Array. Therefore, similar to creating an Array, you can create a Group like these:
// Like Array constructor
let g1 = new Group( p1, p2, p3 );

// wrap an array of Pt into a group
let g2 = Group.fromArray( [ p1, p2, p3 ] );

// Use it just like array too
g1[2] = new Pt(1,2,3);
You can also easily convert an array of number arrays into a Group of Pts:
let g3 = Group.fromArray( [ [1,2], [3,4], [5,6] ] );
g3[0]; // returns Pt(1,2)
g3.p2; // returns Pt(3,4)
Remember that a Group must only contain Pt. This is different from Array which can contain different data types like strings and objects.
let notOk = new Group( [1,2,3], "hello" ); // Don't do this
You can use all the javascript's Array functions in a Group. No need to learn a new API.
g.unshift( new Pt(5, 6) );
g.pop();
let mags = g.map( (p) => p.magnitude() );
Note on typescript: Array functions such as map are typed to return an Array. If you need Group-specific methods on the result, wrap it explicitly: let gg = Group.fromPtArray( group.map( (p) => p.unit() ) );
It's common to apply a Pt function to all the Pts in a Group. You can use forEachPt to do this easily, as long as the Pt function will return a Pt.
let g = new Group( new Pt(1.1, 2.2), new Pt(3.3, 4.4) );
g.forEachPt( "floor" ); // g is now [ Pt(1,2), Pt(3,4) ]
g.forEachPt( "$min", 2, 2 ); // g is now [ Pt(1, 2), Pt(2, 2) ]
g.forEachPt( "dot", new Pt(1,2) ); // Error, dot() doesn't return Pt
There are also a couple additional functions in Group that let you work with array more effectively. Take a look at insert, remove, segments and others.
Interactive example:
guide.group_segments· open live
In this demo, we keep track of the last 50 positions of the pointer in a Group, and draw one circle for every 5 segments. Take a look at the source code and note the use of common Array functions like push and map along with Group functions like segments.
Similar to transformations in Pt, you can use scale, rotate2D etc to transform a Group of Pts. There are also moveBy and moveTo to translate its positions. Basic arithmetics like add and multiply are also included.
These functions affect every Pt in the Group. For a circle, move only its center (circle[0]) to keep its radius unchanged.
Furthermore, you may use $matrixAdd and $matrixMultiply to do advanced matrix calculations.
Creating and cloning
new Group( new Pt(1,2), new Pt(3,4) )
Group.fromArray( [ [1,2], [3,4] ])
Group.fromPtArray( [new Pt(1,2), new Pt(3,4)] )
g.clone()
Getting and setting Pts
g[0]
g.p1
g[1] = new Pt()
g.id = "g01"
Working with array
g.map( (p) => p.unit() ) // support all Array functions
g.insert( [p1, p2], 0 )
g.remove( 3, 2 )
g.segments( 2, 2 )
g.zipSlice(2)
g.$zip()
Positions and bounds
g.boundingBox()
g.anchorFrom( 3 ) // relative to absolute position
g.anchorTo( pt ) // absolute to relative position
g.centroid()
g.interpolate( 0.5 )
g.sortByDimension(1, true)
Calculate
g.add( 10 )
g.multiply( 0.5 )
g.$matrixAdd( g2 )
g.$matrixMultiply( g2, true )
g.forEachPt( "floor" )
Transform
g.moveTo( 100, 100 )
g.moveBy( 10, 1 )
g.scale( 0.5 ).rotate2D( Const.half_pi )
g.shear2D( 0.2 ).reflect2D( line )
Check out the full documentation too.
We are all in the gutter, but some of us are looking at the stars, said Oscar Wilde. To him, and to many of us, a sky full of stars moves us to look into that vast darkness and, with imagination, connect those scattered and flickering dots. What would a sky be without stars, and what would a starry night be without us looking and imagining!
A group of points is never just a mathematical concept. We actively connect the dots and find strange forms and humanistic meanings in them.
In Pts, these acts of imagination are known as "Op". They transform a static point into an active one, a noun into a verb, a vector space into an expressive canvas.
Let's begin with an example. Suppose there are 100 points randomly placed on a canvas, and a pointer moves randomly about. A simple (indeed boring) act of imagination might be to ask: which point is closest to the pointer?
We can draw this whole scene a few lines of code:
// make 100 pts and pointer
var pts = Create.distributeRandom( space.innerBound, 100 );
let t = space.pointer;

// sort the pts
pts.sort( (a,b) =>
  a.$subtract(t).magnitudeSq() - b.$subtract(t).magnitudeSq()
);

// draw the pts
form.fillOnly("#123").points( pts, 2, "circle" );
form.fill("#f03").point( pts[0], 5, "circle" );
form.strokeOnly("#f03", 2).line( [pts[0], space.pointer] );
Interactive example:
guide.op_closest· open live
Notice we just used the javascript sort function to rearrange the pts group by comparing two points' distance to space.pointer. Then we draw the first point in the group (the closest) in red.
The humble sort function is essentially an "Op" by our definition. It transforms a group of points and makes it meaningful. From here on, it's easy to imagine what other structures we can derive from this simple sketch. For example, what if we visualize all points' distances to the pointer in different ways:
pts.forEach( (p, i) =>
    form.point( p, 20 - 20*i/pts.length, "circle" ) )
Interactive example:
guide.op_closest_2· open live
The group of points becomes active. It's somewhat interesting and kind of a mess -- a starting point for further experimentation.
Pts includes many different Ops to help you make the points meaningful. Next we will look at them in more details.
The Op module includes various static functions that deal with specific forms such as Rectangle and Curve, and Num module includes utility classes like Num and Geom for numeric and geometric calculations. Most of them are straightforward and easy to use.
It's time to let our imaginary forces work on these functions. Keeping most of the code from above, let's try the perpendicularFromPt function. Given a line and a point, this Op finds a perpendicular line (ie, shortest distance) between the point and the line.
let path = [new Pt(), space.pointer];
let perpends = pts.map( (p) => [p, Line.perpendicularFromPt(path, p)] );
Interactive example:
guide.op_perpendicular· open live
First we create a line by joining the pointer and the top-left corner at (0,0), and then we convert the set of random points on canvas to perpendicular lines. Also note that, since we don't need additional features from Group, we can just use Array to store the Pts for drawing. Pretty fun and simple, right?
Ops can also construct shapes out of points. Creating a rectangle or a line from 2 points is obvious, so let's get a bit more elaborate.
// create a group of 4 Pts from rectangle
let c = space.center;
let corners = Rectangle.corners( Rectangle.fromCenter( c, space.height ) );

// interpolate with time to make them move
let cycle = (t, i) => Num.cycle( (t+i*500)%3000/3000 );
let pts = corners.map( (p, i) => Geom.interpolate( p, c, cycle(time, i)) );

// close the B-spline by adding first 3 anchors at the end
pts.push( space.pointer );
pts = pts.concat( pts.slice(0, 3) );

// draw the B-spline curve
let curve = Curve.bspline( pts );
form.fill("#f03").stroke("#fff", 3).polygon( curve );
Interactive example:
guide.op_bspline· open live
What's going on here? First, we use Rectangle.fromCenter to make a rectangle and then get its 4 corners as a group.
Then, we define a function called cycle to get a value between 0 to 1 for interpolation. The function takes two parameters t (for time) and i (for index). And we map the 4 corners into 4 interpolated points, making use of Geom.interpolate op.
Next, we add the first 3 points again to the end of the pts group, which is a quick way to close a b-spline curve. Finally, we get the curve from Curve.bspline and just draw it.
Knowing how bspline works, we can easily apply it to our 100 random points. The following sketch also uses Polygon.convexHull: think of it like a rubber band that wraps around a group of points.
Interactive example:
guide.op_bspline_2· open live
That was quick! By combining different ops together, you can quickly try out and compare different options in forms and interactions.
If you think of code like a narrative, then the static ops are like monologues — telling the story in a dull way.
// dull
Polygon.convexHull( pts )

// meh
pts.convexHull()

// fun
makeRubberBand()
The op function in both Pt and Group enables you to turn your dull code into an expressive one. Let's see how it works:
let makeRubberBand = pts.op( Polygon.convexHull );
makeRubberBand();
When you supply op with a function, it applies the Pt or Group as a parameter to that function, and returns a new function with one less parameter. That's all. So here Polygon.convexHull(group) becomes makeRubberBand() since pts is applied as the first parameter group. If it's still confusing, think of it as a noun ("the pts") turning into a verb ("make rubber band using the pts").
Let's illustrate this with a concrete example. Suppose we want to make 50 lines by pairing the 100 random points, and then find out which lines intersect with another line drawn by the pointer. What's the code?
It only takes 3 lines:
let pairs = pts.segments(2, 2);
let hit = new Group(space.center, space.pointer).op( Line.intersectLine2D );
let hitPts = pairs.map( (pa) => hit( pa ) ).filter( Boolean );
Interactive example:
guide.op_intersect· open live
Demo: Creating line segments from a sorted array of points, and then check their intersections with another line drawn by pointer.
First, we take every 2 points in pts to make 50 lines. Next, we make a line from space's center to pointer, and immediately turn it into an op of Line.intersectLine2D. Lastly we just apply the hit function to each pair and keep its intersection points.
This approach works best if the op will be re-used in different scenarios, or if it can make the code easier to read. Of course, you can always use the static intersectLine2D function inside the map(...), or even create a custom function and call it hit. Just like there're many ways to tell a story, there're many ways to write code.
Num from "Num" module includes helper functions to simplify numeric calculations.
Num.cycle( 0.3 ); // cycle between 0...1...0
Num.mapToRange( 5, 1,100, 0, 2 ); // map a value to new range
Num.lerp( 1, 100, 0.2 ); // linear interpolation
Geom from "Num" module includes helper functions to simplify geometric calculations.
Geom.boundAngle( 361 ); // bound between 0 to 360
Geom.withinBound( p1, top_left, bottom_right );
Geom.interpolate( p1, p2, 0.3 );
Line from "Op" module helps you create and work with lines.
Line.fromAngle( p1, Math.PI/3, 10 ); // create with angle and distance
Line.collinear( p1, p2, p3 );
Line.intersectRay2D( ln1, ln2 );
Line.subpoints( ln1, 5 ); // get 5 evenly distributed pts on the line
Rectangle from "Op" module helps you create and work with rectangles.
Rectangle.fromCenter( center, 100, 50 );
Rectangle.corners( rect );
Rectangle.sides( rect );
Rectangle.quadrants( rect ); // get 4 inner rectangles
Rectangle.intersectRect2D( rect1, rect2 );
Circle from "Op" module helps you create and work with circles.
Circle.fromCenter( center, 10 );
Circle.fromRect( rect );
Circle.toRect( c1 );
Circle.intersectCircle2D( c1, c2 );
A circle is a Group of two Pts: its center and its radius. To move it without changing its radius, move only the first Pt:
let c = Circle.fromCenter( [10, 10], 5 );
c[0].to( 20, 20 );
Calling c.moveTo(20, 20) would move both Pts, changing the radius too.
Triangle from "Op" module helps you create and work with triangles.
Triangle.fromCircle( c ); // equilateral triangle
Triangle.fromRect( rect );
Triangle.incircle( tri );
Triangle.orthocenter( tri );
Triangle.medial( tri );
Polygon from "Op" module helps you create and work with polygons.
Polygon.centroid( poly );
Polygon.convexHull( poly );
Polygon.lines( poly ); // get line segments
Polygon.intersectPolygon2D( poly, lines );
Path from "Op" module combines polygons with boolean operations. List the shapes from back to front; every function returns the rings of a polygon with holes, which form.compound draws as one path.
Path.unite( [star, disc] ); // merge into one polygon
Path.minusFront( [star, disc] ); // cut the disc out of the star
Path.intersect( [a, b, c] ); // the area inside all three
Path.exclude( [a, b] ); // everything but the overlap
Path.divide( [a, b] ); // one polygon per face
Path.crop( [photo, frame] ); // the faces of photo inside frame
form.fillOnly("#f03").compound( Path.minusBack( [wall, window] ) );
Curve from "Op" module helps you create and work with curves.
Curve.catmullRom( pts );
Curve.cardinal( pts );
Curve.cardinal( pts, 20, 0.3 ); // step and tension parameters
Curve.bezier( pts );
Curve.bspline( pts );
Curve.cardinalToBezier( pts ); // convert anchors to bezier control points
form.bezier( Curve.cardinalToBezier( pts, 0.5, 0.5 ) ); // draw a centripetal curve as a native path
form.bezier( Curve.bsplineToBezier( pts ) ); // b-spline as a native path
Curve.bezierToBspline( chain ); // and back: bezier chain to b-spline anchors
Curve.bezierToCardinal( chain ); // bezier chain back to cardinal anchors
Check out the full documentation too.
Space provides a general context for its points to be expressed. Each subclass of Space represents a specific context. Pts includes CanvasSpace which corresponds to the canvas element, and SVGSpace which lets you create vector graphics in svg format instead. There is also a deprecated HTMLSpace which renders forms in basic html elements.
CanvasSpace can be created like this:
let space = new CanvasSpace( "#hello" );
space.setup({ bgcolor: "#123", retina: true });
The "#hello" is a selector string that selects an element in the html page. If the element is a <canvas>, it will be used by CanvasSpace. If the element is a <div> or other block element, a new <canvas> will be appended into it. You may also pass a HTMLElement directly, instead of a query selector string.
Once the space is created, you can optionally call the setup function to specify its background color (bgcolor) and other properties. Take a look at the setup documentation for more.
Now the space is set up, let's look at what it can do.
A space by itself is void of form. Let's add a "player" to it. A player can be either a function or an object with specific properties.
space.add( (time, ftime) => {
  // do things
});
In the above, we use add to add a simple callback function. It has 2 parameters: time which gives the current running time, and ftime which gives the time taken to draw the previous frame. This callback is like an animation loop, which will be called continuously when the player plays.
Let's look at a more elaborate player:
space.add( {
  start: (bound, space) => {
    // code for init
  },
  animate: (time, ftime, space) => {
    // code for animation
  },
  action: (type, x, y, event) => {
    // code for interaction
  },
  resize: (size, event) => {
    // code for resize
  }
} );
Here we add an object that conforms to the IPlayer interface, which defines 4 optional callback functions:
startfunction is called when the space is ready. It includes 2 parameters:boundwhich returns the bounding box, andspacewhich returns its space.
-
animatefunction is called continuously when the space plays. It includes 2 parameters:timewhich gives the current running time, andftimewhich gives the time taken to draw the previous frame. -
actionfunction is called when a user event is detected. It includes 4 parameters:typeis a string that returns the action's name. Common types include "up", "down", "move", "drag", "drop", "over", "out", "click", "contextmenu", "pointerdown", "pointerup", "keydown", and "keyup".xandyreturn the position at which the action happened, andeventreturns the actual event object. See also:bindMouse,bindTouch, andbindKeyboard. -
resizefunction is called when the space is resized. It includes 2 parameter:sizewhich returns the new size, and event which returns the event object. You'll also need to add{resize: true}insetupto enable tracking.
You may add multiple players into a space, each taking care of specific parts of a scene. Use add and remove to manage a space's players.
You can tell a space to play or stop its players using play, stop and other functions:
space.play();
space.playOnce( 1000 ); // play 1 sec then stop
space.pause();
space.resume();
space.stop();
Using bindMouse, bindTouch, and bindKeyboard, you can easily make the space respond to user interactions. Once the space can receive events, you can track them using a player's action callback function, as described above.
// You can chain multiple functions together
space.bindMouse().bindTouch().play();
If you use interactive UI elements like UIButton or UIDragger, you can skip the action callback entirely: track forwards the space's events to them for you.
space.track( myButton ); // myButton now receives clicks, hovers, drags...
space.untrack( myButton ); // ...until you stop tracking it
CanvasSpace also provides a couple convenient properties which you may access once the space is initiated. .pointer gives you the current pointer position. .size, .center, .width, .height and .innerBound are handy to get a space's size and center point. .element and .parent returns the html elements of this space.
CanvasSpace also supports offscreen rendering which may help with rendering complex scene. Take a look at the source code of this study for more.
In the Get Started guide, we made an analogy of paper and pencil when introducing Space and Form. So CanvasForm represents a pencil to draw on CanvasSpace. You can get the form with a single function call.
let space = new CanvasSpace("#paper");
let form = space.getForm(); // get default CanvasForm
CanvasForm includes many convenient functions to draw shapes on <canvas> element. Usually, you'll use these drawing functions in a player's animate function like this:
// Draw points inside the animate callback function
space.add( (time, ftime) => {
    form.stroke("#fff").fill("#f03").circle( c );
    form.point( p, 10 );
} );
If you need more advanced canvas functions, you can get canvas' rendering context by accessing ctx property. For example: form.ctx.clip().
Interactive example:
guide.space_form· open live
And since both Space and Form are javascript classes, you can extend them to override its functions and add new ones.
For supported drawing functions, you can switch your code from CanvasSpace to SVGSpace without changing your drawing code: initiate the space as SVGSpace instead of CanvasSpace, and space.getForm() will return an SVGForm, which shares the CanvasForm drawing API — shapes, gradients, dashes, text and more render as svg automatically.
const space = new SVGSpace( "#elem" ).setup({ bgcolor: "#123", resize: true });
const form = space.getForm();
// ... the same drawing code as canvas
If you use quickStart, it picks the space for you: mount on an <svg> element and you get an SVGSpace; mount on a <canvas> or <div> and you get a CanvasSpace.
SVG does not currently support clipping, image-data writes, source-cropped image drawing, canvas patterns (Img.pattern), canvas offscreen buffers, or Porter-Duff composites such as source-in. Each warns once and draws nothing. Use CanvasSpace if your sketch needs these functions.
Under the hood, consecutive shapes that share styles are merged into single svg elements per frame, so the output stays fast and compact. To export the current frame as an svg file, use SVGSpace.toSVG — pass true to get one element per shape, which is easier to edit in vector graphics tools.
(In earlier versions of Pts, SVG rendering required a form.scope(this) call in each animate callback. This is no longer needed — existing code that calls it will still run, as the function is kept as a harmless no-op.)
There is also an HTMLSpace that renders forms in basic html elements. It is deprecated and will be removed in a future major version — use SVGSpace for DOM-based output instead. Because of the limitations of HTML, it cannot draw polygon, arc, and some other shapes.
If you use Pts with React or other web rendering frameworks, it will be better to use the props and states of their virtual DOM implementations instead.
The quickest way to start is to use the quickStart function, which initiates a CanvasSpace and adds space and form instances into current scope. You can create an interactive piece in 2 lines of code:
Pts.namespace( this ); // not needed if using npm package

let run = Pts.quickStart( "elemID", "#f03" )
run( (time, ftime) => form.fill("#f03").point( space.pointer, 10, "circle" ) );
The following snippet is a typical template for creating a Pts space and form. Use this if you need more than an animation loop. You can add either an animation function or an IPlayer object to a space. (See above for details)
Pts.namespace( this ); // not needed if using npm package

var space = new CanvasSpace("elemID").setup({ retina: true });
var form = space.getForm();

space.add( (time, ftime) => {
  form.fill("#f03").point( space.pointer, 10, "circle" );
} );

space.bindMouse().bindTouch().play();
Canvas element has only basic supports for text, making it difficult to create and experiment with typographic layouts. Pts provides additional functions to help you position text contents on canvas. In this guide, we will take a look at these features.
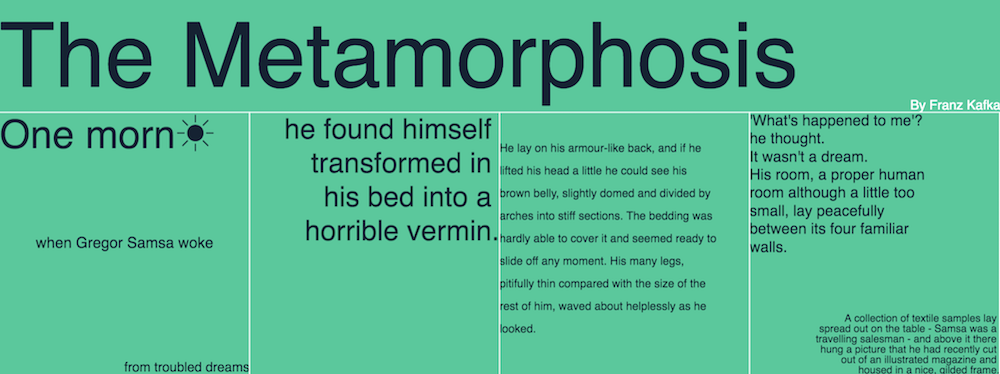
You can view this typographic layout demo on the demo page.
The textBox function in CanvasForm lets you control how a single-line text should be displayed inside a box.
First, specify a rectangular area (specified by a Group) and a text string. Optionally, you can also specify where the text should be placed vertically, as well as the characters used for abbreviation when the text truncates. For example:
form.textBox( area, "hello world", "bottom", "..." );
Below is a demo of truncated text at placed at top, middle, and bottom of a a rectangle. Move your pointer over to change the size of the area.
Interactive example:
guide.canvas_textbox· open live
Canvas API already provides textBaseline and textAlign for text alignments. Pts makes these more convenient via alignText function. Use it with textBox to position your text within a rectangular area.
Interactive example:
guide.canvas_aligntext· open live
For multi-line text, you may use the paragraphBox function. It works similar to textBox with extra options to specify line-height and overflow. For example:
form.paragraphBox( area, "hello world", 1.5, "middle" );
Interactive example:
guide.canvas_paragraphbox· open live
The text overflow will be cropped by default. If you prefer to let them overflow, set the crop parameter to false. If your text contains multiple paragraphs, you may separate them with line breaks (\n). For example:
form.paragraphBox( area, "hello \n\n world", 1.5, "middle", false );
The following demo shows 2 paragraphs with different line-height and alignments and no crop.
Interactive example:
guide.canvas_paragraphbox2· open live
For long paragraphs, you may consider using fontWidthEstimate. This will use a simple heuristic to estimate text width, which is less accurate but may be faster.
Hope these functions will give you more control over text on canvas, especially when you want to play with typographic experiments. However, putting text on canvas may not be a good approach in many cases. For example, it has poor accessibility (cannot be read for screen reader) and cannot be indexed by search engines.
SVGForm supports these text functions too.
The text layout functions are currently implemented in CanvasForm.
// put text content in an area defined by a Group
form.textBox( area, content );

// put in bottom, use "..." when truncated
form.textBox( area, content, "bottom", "..." );

// align text before putting into textBox
form.alignText("left", "top").textBox( area, content );

// put multi-line text in a box with line-height of 1.5
form.paragraphBox( area, content, 1.5 );

// multi-line text center aligned, place in middle and allow overflow
form.alignText("center").paragraphBox( area, content, 1.5, "middle", false );

// Use heuristics to estimate font width
form.fontWidthEstimate(true).paragraphBox( area, content );
Tempo is a lightweight utility class which helps you create animation sequences intuitively. It's an alternative to many other great animation libraries (which you can use with Pts too).
Typically, animation sequences are often implemented as a curated list of tweens in milliseconds. But what if we take the idea one level higher, and treat it like a dance? Like One-two-three, One-two-three...
Let's start by counting the beats. Tempo is usually measured in beats-per-minute (bpm), so there are two ways to initiate a Tempo instance: by setting a bpm, or specifying the duration of a beat in milliseconds.
// 120 beats-per-minute, or 500ms per beat
let tempo = new Tempo( 120 );
space.add( tempo ); // let the Space update it on every frame

// 500ms per beat, or 120 bpm
let another = Tempo.fromBeat( 500 );
The essential function is every, which counts the beats and triggers the callback functions you specified. It's like a smart metronome.
let everyTwo = tempo.every( 2 ); // count every 2 beats
let everyTen = tempo.every( 10 ); // count every 10 beats
The every function returns an object with two chainable functions: start(...) and progress(...). These functions let you attach custom callback functions that respond to animation events.
The start function lets you set a callback to be triggered at the start of every n-beats period. For example:
// at the start of every 2-beats period, do something
everyTwo.start( (count) => ... )
The progress function lets you set a callback during the progress of every n-beats period. The second parameter t starts at 0 and moves toward 1 in every period, so you can use it to interpolate values and tween properties.
// during every 10-beats period, do something
everyTen.progress( (count, t, time, isStart) => ... )
Let's look at an example. Here the tempo is set to 60 BPM (or 1 second per beat), and we design the behaviors so that:
- Every 1 beat, the square's color changes
- Every 2 beats, the circle's color changes and the rotation completes once
Interactive example:
guide.tempo_progress· open live
Pretty easy to create synchronized animation sequences, right? Let's try a few more example.
Tween: Since the t parameter in progress callback function goes from 0 toward 1, we can map its value to a Shaping function and change the tweening style. Another neat trick is to use Num.cycle to map the t value from [0...1] to [0...1...0].
everyTwo.progress( (count, t, time, isStart) => {
    let tt = Shaping.elasticOut( t );
    ...
})
Interactive example:
guide.tempo_shaping· open live
Stagger: You can offset a beat's timing by a small difference to create a "stagger" effect. Specify an offset time (in milliseconds) in the optional second parameter. A positive offset activates sooner, and a negative offset activates later.
let fn = (count, t) => ... ;
everyTwo.progress( fn, 100 ); // activate 100ms sooner
Interactive example:
guide.tempo_stagger· open live
Rhythm: Set a custom rhythm by passing a list of beats in the every function.
let custom = tempo.every( [2, 2, 1, 1] ); // Taaa, Taaa, ta-ta.
Interactive example:
guide.tempo_rhythm· open live
By changing bpm by setting the .bpm property, you can control the speed of your animation. This makes it easier to synchronize your animations with music or at specific intervals.
tempo.bpm = 100; // set new bpm
tempo.bpm += 20; // make it 20 beats faster per minute
Try moving your cursor horizontally to change the bpm in this example:
Interactive example:
guide.tempo_control· open live
There are two ways to stop an animation. You can either return true within start or progress callback functions, or include a name in the third parameter of the callbacks and then call tempo.stop( name ).
let walking = (count, t) => {
   // ...
   return (count > 5);  // return true will stop this animation
}

tempo.every( 1 ).progress( walking, 0, "robot" );
tempo.stop( "robot" ); // another way to stop this animation
Create a Tempo instance with specific bpm.
tempo = new Tempo(120); // 120 bpm
tempo = Tempo.fromBeat( 100 ); // one beat every 100ms
space.add( tempo ); // update it from the Space animation loop
Count beats and trigger animation callbacks
let fiveBeats = tempo.every( 5 );

fiveBeats.start( (count) => {
  // do something at start of every period
  return count > 5; // optionally return true to stop animating
});

fiveBeats.progress( (count, t, time, isStart) =>  {
  // do something during each period
});
Audio and visual forms complement each other, giving us new opportunities to create unique expressions. Pts simplifies a subset of Web Audio API to help you with common tasks like playbacks and visualizations.
Before we dive in, let's review a snippet of using Pts' Sound functions. It's pretty straightforward.
// Load sound and attach analyzer
Sound.load( "/assets/spacetravel.mp3" ).then( s => {
  sound = s.analyze(bins);
});

// ...

// Visualize frequencies (within animate loop)
sound.freqDomainTo( space.size ).forEach( (t, i) => {
  form.fill( colors[i%5] ).point( t, 30 );
});
Here is the result. Click play button to start.
Interactive example:
guide.sound_simple· open live
Music snippet from Space Travel Clichés by Mr Green H.
How about something more elaborate? Let's try a silly and fun visualization.
Interactive example:
guide.sound_visual· open live
Click play button and move your pointer around the character. Music snippet from Space Travel Clichés by Mr Green H.
Let's get some sounds to begin! Do you want to load from a sound file, receive microphone input, or generate audio dynamically? Pts offers four handy static functions for these.
- Use
Sound.loadto load a sound file with a URL or a specific<audio>element. The Promise resolves when enough data has loaded to play through, but playback does not start automatically. You can check if the audio file is ready to play by accessing.playableproperty.
Sound.load( "/path/to/hello.mp3" ).then( s => sound = s );
Sound.load( audioElem ).then( s => sound = s ); // load from <audio> element
- Use
Sound.loadAsBufferto decode the entire file into anAudioBuffer. This does not stream, but it can provide more consistent analysis and replay behavior across browsers.
Sound.loadAsBuffer( "/path/to/hello.mp3" ).then( s => sound = s );
- Use
Sound.generateto create a sound. You may also generate sounds using other libraries like Tone.js. Read more in Advanced section below.
let sound = Sound.generate( "sine", 120 ); // sine oscillator at 120Hz
- Use
Sound.inputto get audio from default input device (usually microphone). This will return a Promise object which will resolve when the input device is ready, or reject if the device is unavailable or permission is denied.
let sound;
Sound.input().then( s => sound = s ).catch( err => ... ); // default input device
Sound.input( constraints ).then( s => sound = s ); // advanced use cases
Here's a basic demo of getting audio from microphone:
Interactive example:
guide.sound_mic· open live
You may first need to allow this page to access microphone, and then click the record button. We also make the recording stop when the pointer leave the demo area so that your microphone is not always on.
You can then start and stop playing the sound like this:
sound.start();
sound.stop();
sound.toggle(); // toggle between start and stop
sound.playing; // boolean to indicate if sound is playing
sound.volume = 0.5; // change the volume (default is 1)
Browsers commonly block audible playback until the user interacts with the page, so start sound from a click or another user gesture.
Using the analyze function, we can attach an analyzer to keep track of the data in our Sound instance.
sound.analyze( 128 ); // Call once to initiate the analyzer
This will create an analyzer with 128 bins (more on that later) and default decibel range and smoothing values. See analyze docs for description of the advanced options.
There are two common ways to analyze sound data. First, we can represent sounds as snapshots of sound waves, which correspond to variations in air pressure over time. This is called the time-domain, as it measures amplitudes of the "waves" over time steps.
To get the time domain data at current time step, call the timeDomain function.
// get an uint typed array of 128 values (corresponds to bin size above)
let td = sound.timeDomain();
Optionally, use the timeDomainTo function to map the data to another range, such as a rectangular area. You can then apply various Pts functions to transform and visualize waveforms in a few lines of code.
// fit data into a 200x100 area, starting from position (50, 50)
let td = sound.timeDomainTo( [200, 100], [50, 50] );

form.points( td ); // visualize as points
Since you'll typically call these functions on every animation frame, you can optionally pass the resulting Group back in the last parameter to reuse it, which avoids creating new objects per frame:
let td; // keep a reference across frames
td = sound.timeDomainTo( [200, 100], [50, 50], [0, 0], td ); // reused
In the following example, we map the data to a normalized circle and then re-map it to draw colorful lines.
sound.timeDomainTo( [Const.two_pi, 1] ).map( t => ... );
Interactive example:
guide.sound_time· open live
In a similar way, we can access the frequency domain data by freqDomain and freqDomainTo. The frequency bins are calculated by an algorithm called Fast Fourier Transform (FFT). The FFT size is 2 times the bin size and both need to be powers of 2. (Recall that we set bin size to 128 earlier). You can quickly test it with a single line of code:
form.points( sound.freqDomainTo( space.size ) );
The following is a basic frequency-domain example for your reference.
Interactive example:
guide.sound_frequency· open live
The interplay of sounds and shapes offer many possibilities indeed. Make good use of your imagination to create something beautiful, fun, and unexpected!
If media-element analysis behaves differently across target browsers, load and decode the whole file with loadAsBuffer. This uses an AudioBuffer instead of a streaming <audio> element.
Sound.loadAsBuffer( "/path/to/hello.mp3" ).then( s => sound = s );
AudioBuffer doesn't support streaming and its source node can only be played once. Pts recreates the buffer for you when you call start or toggle again, so replay just works. If you want to prepare a replay manually, use the convenient createBuffer function without parameter to re-use the previous buffer.
// optionally, prepare a replay manually by reusing the loaded buffer
sound.createBuffer();
For custom use cases with other libraries, you can create an instance using Sound.from static method. Here's an example using Tone.js:
const synth = new Tone.Synth().toDestination();
const context = Tone.getContext().rawContext;
const tap = context.createGain();
synth.connect( tap );
const sound = Sound.from( tap, context ).analyze( 128 );
The following demo generates audio using Tone.js and then visualizes it with Pts:
Click image to open tone.js demo. See source code here.
If needed, you can also directly access the following properties in a Sound instance to make full use of the Web Audio API.
.ctxto access theAudioContextinstance.nodeto access theAudioNodeinstance.streamto access theMediaStreaminstance if applicable.sourceto access theHTMLMediaElementif you're playing from a sound file.bufferto access or set theAudioBufferif you're usingloadAsBuffer
Also note that calling start function will connect the AudioNode to the destination of the AudioContext, while stop will disconnect it.
Web Audio covers a wide range of topics. Here are a few pointers for you to dive deeper:
- Web Audio API book and samples by Boris Smus
- tone.js is a framework for creating interactive music in the browser
- tonal.js is a functional music theory library for javascript
- MDN documentation on Web Audio API
Creating and playing a Sound instance
Sound.load( "path/file.mp3" ).then( d => s = d ); // from file
Sound.loadAsBuffer( "path/file.mp3" ).then( d => s = d ); // using AudioBuffer instead
Sound.input().then( d => s = d ); // get microphone input
s = Sound.generate( "sine", 120 ); // sine wave at 120hz
s = Sound.from( node, context ); // advanced use case

s.start();
s.stop();
s.toggle();
Getting time domain and frequency domain data
s.analyze( 256 ); // Create analyzer with 256 bins

s.timeDomain();
s.timeDomainTo( area, position ); // map to a area [w, h] from position [x, y]

s.freqDomain();
s.freqDomainTo( [10, 5] ); // map to a 10x5 area
g = s.freqDomainTo( area, position, trim, g ); // reuse a Group across frames
The standard API for working with images on canvas is rather laborious, and often takes the fun out of creative coding. In Pts, the Img class simplifies the common use cases, from loading and displaying static images to generating dynamic textures, so that you can get started quickly. Let's take a look.
We will start a minimalistic example: Load an image and display it on canvas. This can be done in 2 lines of code:
const img = await Img.load( "/assets/demo.jpg" );
space.add( time => form.image( space.pointer, img ) );
Interactive example:
guide.image_load· open live
The above example uses the static function Img.load, which returns a Promise that resolves to the loaded image, and then uses CanvasForm's image function to display it. A load failure rejects the Promise.
You can also create an Img instance yourself and call the instance function load, which is handy when you want to configure the instance first. An example:
(async function() {
  let img = await new Img().load( "/assets/img_demo.jpg" );
  space.add( time => form.image( space.pointer, img ) );
})();
Once the image is loaded, you can access its properties like width and height and manipulate its data. We will be discussing these advanced use cases next.
Interactive example:
guide.image_load2· open live
In this example, we access the image's original width and height after it's loaded, and then rescale it to fit the canvas size.
When you create an Img instance with its editable parameter set to true, it will hold an internal canvas to support image manipulations. It will also match the pixel-density of your display. An example:
// Create an editable img with the current space's pixelScale
let img = new Img( { editable: true, pixelScale: space.pixelScale } );
img.load( "/assets/demo.jpg" ).then( ... );

// Alternatively, pass the options to the static load function
let img2 = await Img.load( "/assets/demo.jpg", { editable: true, pixelScale: space.pixelScale } );
You can do a lot with an editable image. Let's cover a couple common use cases.
The pixel function supports a very common use case: specify a pixel position on the image, get its RGBA color values, and do something with it. A wide range of visual possibilities may open up if you use this simple function creatively.
Interactive example:
guide.image_pixel· open live
Try scribbling in different regions of the image to change it. This demo combines Create.delaunay with Img.pixel.
Another common use case is to crop a region of the image. The crop function takes a bounding box and returns an ImageData. You can then use CanvasForm's imageData to draw the region.
form.imageData( [0, 0], img.crop( bound ) );
Let's try this in a demo:
Interactive example:
guide.image_crop· open live
It's more efficient to draw ImageData directly on canvas. If needed, you can also export it to a blob using Img.imageDataToBlob and then load it into an image again.
Since an editable Img stores an internal canvas, you can leverage CanvasForm's many drawing functions to draw directly on it. It's that easy!
After the image is loaded, you can use getForm to create a CanvasForm for its internal canvas. For example:
const img = await Img.load( "demo.jpg", { editable: true } );
const imgForm = img.getForm();
if (!imgForm) throw new Error( "Expected an editable image" );
...
imgForm.fill("#f00").rect( rect );
The following is a demo of drawing rectangles with matching pixel colors on the image canvas.
Interactive example:
guide.image_edit· open live
Additionally, the filter function supports image filter effects like desaturation and blur (See the full list supported by canvas). Note that some effects may not work in mobile browsers.
img.filter( "blur(10px) contrast(20%) saturate(0%)" )
To display the edited image, use CanvasForm's image function and pass img.current as the image source.
// draw internal image canvas
form.image( [0, 0], img.current );
As we are only editing an internal canvas, the original image is unchanged until it's explicitly updated. Use sync, which returns a Promise, to update the original image when needed: await img.sync().
You can also work at the pixel level: setPixel writes a color into the cached pixel data, updatePixels applies those changes onto the canvas, and loadPixels refreshes the cache after you've drawn on the canvas directly. When you're done with an Img, call dispose to release its resources.
In a similar way, you can treat an image (or an image canvas) as a pattern to fill an area. One difference is that we'll get a CanvasPattern instance for use in form.fill(...), instead of an image for form.image(...).
const pattern = await Img.loadPattern( "tile.jpg", space );
...
form.fill( pattern ).rect( rect );
Interactive example:
guide.image_pattern· open live
A pattern can be transformed via the standard canvas API pattern.setTransform. However, its documentation is confusing and incomplete. Pts provides an easy way to create a DOMMatrix for this use case.
const m = new Mat().translate2D( ... ).rotate2D( ... ).domMatrix;
pattern.setTransform( m );
Interactive example:
guide.image_pattern2· open live
All together, the Img class offers a wide range of potential creative expressions. For example, you can create a dynamic image and use it as a pattern fill (As shown in this demo).
It's now your turn to experiment!
-
Anticipate screens with different pixel density. You can pass a CanvasSpace's
pixelScalewhen creating an Img instance. (See example in Cheatsheet below) -
You can
loadan image from a base64 string or an url, or from a blob via thefromBlobfunction. To export the current image, usetoBase64ortoBlobfunctions. -
CanvasForm's
imagedrawing function can take either an Img instance or a CanvasImageSource which includes various kinds of image objects like HTML Image or Canvas. -
Typically, you can't load an image from another domain due to security concerns. But if the image server allows for it and you want to do it, you can set the
crossOriginparameter totruewhen creating anImginstance. More details here.
Creating, loading, displaying
// Simplest way
let img = await Img.load( "demo.jpg");

// Load an editable image that matches the screen's resolution
let img = await Img.load("demo.png", { editable: true, pixelScale: space.pixelScale } );

// Equivalent, creating the instance first
let img = new Img( { editable: true, pixelScale: space.pixelScale } );
await img.load("demo.png")

// Display an image automatically when it's loaded
form.image( [0,0], img );

// Load a pattern and use it as fill
let pattern = await Img.loadPattern( "tile.jpg", space );
form.fill( pattern ).rect( rect );

// Get a pattern from an Img instance
const pattern = img.pattern();
form.fill( pattern ).rect( rect );
Useful properties
img.loaded; // true if the image is loaded
img.image; // the original image
img.canvas; // the internal canvas of an editable Img
img.ctx; // the context which can be used to create a CanvasForm
img.pixelScale; // pixel density which usually matches the space's
Editing an image
img.crop( rect )
img.resize( [0.5, 0.5], true );
img.filter( "blur(10px) contrast(200%)" );
img.pixel( space.pointer );

// Draw on image
let imgForm = new CanvasForm( img.ctx );
imgForm.fill( "#f00" ).point( space.pointer, 20 );

// Export as base64 string
img.toBase64();

// Getting a DOMMatrix instance for pattern transforms
const m = img.scaledMatrix.rotate2D(...).domMatrix;
pattern.setTransform( m );
form.fill( pattern ).rect( rect );
Pts can be used on its own or alongside tools made for different workflows. The ecosystem currently starts with these two projects.
react-pts-canvas is a React component for creating Pts canvases inside a React application. It connects a component's lifecycle to a Pts space and provides callbacks for setup, animation, actions, and resizing.
<PtsCanvas
  background="#9ab"
  onAnimate={ (space, form, time, ftime) => {...} }
/>
Learn more at react.ptsjs.org and install it from npm.
pts-render is a CLI tool for Pts.js. Use it to work directly from the terminal without a browser.
Learn more at cli.ptsjs.org and install it from npm.
Pts.py is a new take on Pts ideas implemented in Python. It's an early-stage library.
Learn more at ptspy.org. Give it a try!
Have you created a library, tool or project based on Pts? Please let us know by filing an issue.
Generate dynamic gradients using composite effects. Click to change colors.
Open live · Source code · GitHub
Grid cells filled with simple linear gradient, over a complex radial graident background.
Open live · Source code · GitHub
Canvas textbox that fit single and multiline text in boxes with truncations. Resize browser window to reflow text.
Open live · Source code · GitHub
A set of points records the mouse trail as the mouse moves. When mouse is down and dragging, the trail will extend. When released, the trail gradually shortens.
Open live · Source code · GitHub
Draw shapes based on the size of space. Resize the window and the drawing will update.
Open live · Source code · GitHub
A circle and a donut meets. Indicate their points of intersections.
Open live · Source code · GitHub
A circle moves in a field of line segments. Check intersections on both line paths and line segments, and highlight the intersection points and paths.
Open live · Source code · GitHub
A circle moves in a field of random points. If a point intersects with the circle, it grows bigger and moves slightly toward the circle's center.
Open live · Source code · GitHub
Create a subdivided grid colored with HSL color space. The pointer position updates the hue.
Open live · Source code · GitHub
Create a gradient grid using Lab color space. The pointer position updates the lightness. With subtle wave-like animation.
Open live · Source code · GitHub
Generate Delaunay and Voronoi tessellations. When 100 points are added, the diagram will animate and display guidelines at pointer position.
Open live · Source code · GitHub
A flock roams freely, each agent trailing a line colored by its heading. Move the pointer to scatter the flock and light up their heads, or hold it down to stir a vortex.
Open live · Source code · GitHub
A retro-style dazzling effect created by a grid whose cells change color and size based on their distances to the pointer.
Open live · Source code · GitHub
Using Perlin noise to animate a line and a grid. Move mouse or touch around the canvas to change speed.
Open live · Source code · GitHub
Sampling circular areas with evenly spaced points. Move the pointer to comb, and click anywhere to settle back.
Open live · Source code · GitHub
Add a point to a trail as the pointer moves. Use those points as controls for a continuous bezier curve.
Open live · Source code · GitHub
Create a set of points around a center point, varying each's radius slightly. Draw a b-spline curve and also show the corresponding bezier anchors and handles.
Open live · Source code · GitHub
Draw cardinal curves with different tensions, plus a centripetal one converted to bezier. Touch it with cursor to modify it.
Open live · Source code · GitHub
Interpolate every 2 corners of a rectangle to draw inner rectangles recursively.
Open live · Source code · GitHub
Draw a series of perpendicular lines along a diagonal path to visualize sine waves.
Open live · Source code · GitHub
A dynamic pattern-fill that responds to mouse position.
Open live · Source code · GitHub
The laser pointers are drawing some words in Chinese. Click to make it disappear.
Open live · Source code · GitHub
A set of lines revolves around a center point. Each line's color depends on whether the pointer lies on its left or right side, and if it's collinear with the pointer.
Open live · Source code · GitHub
Lines rotating in a grid. Intersections between lines are marked with circles. Move the pointer to change the rotation speed.
Open live · Source code · GitHub
In a field of points that revolves around a center, draw a perpendicular line from each point to a path.
Open live · Source code · GitHub
Shapes scattered by Poisson-disk sampling, some merged from bubbles and some with holes, are cropped by a donut that follows the pointer. The cropped areas are filled in each shape's own color. Click to switch the cropping shape.
Open live · Source code · GitHub
Particles colliding with each other in space. Move the pointer to hit them like billiard balls.
Open live · Source code · GitHub
Physics simulation with various polygons and circles. Move pointer to control the triangle.
Open live · Source code · GitHub
Use convex hull to envelope a set of points. Move the pointer to modify the boundary.
Open live · Source code · GitHub
Koch snowflakes with interpolation.
Open live · Source code · GitHub
Move the pointer to creates confetti. A simple example to show how to extend Pt class.
Open live · Source code · GitHub
Calculate a unit vector from center to mouse position. Use its direction to control a grid of lines.
Open live · Source code · GitHub
An example of using quickStart function to create this in 5 lines of code
Open live · Source code · GitHub
A visualization of various shaping functions, which are also applied to change the circles' sizes correspondingly. Based on the algorithms from Robert Penner and Golan Levin
Open live · Source code · GitHub
Basic example of loading sound and visualizing frequencies. Music from 'Space Travel Clichés' by MrGreenH.
Open live · Source code · GitHub
A silly and elaborate character that responds to sound. Music from 'Space Travel Clichés' by MrGreenH.
Open live · Source code · GitHub
Play a generated tone, and control its frequency by pointer position.
Open live · Source code · GitHub
Play snippets of drum, tambourine, and flute. Visualize their waveforms in radial lines.
Open live · Source code · GitHub
This sketch is rendered as SVG. Using your browser's inspector, you can take a look at the svg element and copy it into a svg file too.
Open live · Source code · GitHub
A minimal starting point for a Pts sketch.
Open live · Source code · GitHub
Fitting four circles inside and outside of four triangles, which are connected to the pointer.
Open live · Source code · GitHub
Click the triangle, and drag the circles. An abstract composition inspired by Miró.
Open live · Source code · GitHub
Align text demo in Typography guide.
Open live · Source code · GitHub
Paragraph box demo in Typography guide.
Open live · Source code · GitHub
Paragraph box demo in Typography guide.
Open live · Source code · GitHub
Text box demo in Typography guide.
Open live · Source code · GitHub
Demo in getting started guide.
Open live · Source code · GitHub
Demo in getting started guide.
Open live · Source code · GitHub
Demo in getting started guide.
Open live · Source code · GitHub
Demo in getting started guide.
Open live · Source code · GitHub
Demo in getting started guide.
Open live · Source code · GitHub
Demo in getting started guide.
Open live · Source code · GitHub
Demo in Group guide.
Open live · Source code · GitHub
Demo in Group guide.
Open live · Source code · GitHub
Demo in cropping images
Open live · Source code · GitHub
Demo in editing images
Open live · Source code · GitHub
Demo in loading images
Open live · Source code · GitHub
Demo in loading images
Open live · Source code · GitHub
Demo in loading images
Open live · Source code · GitHub
Demo in loading images
Open live · Source code · GitHub
Demo in getting image pixels
Open live · Source code · GitHub
B-spline demo in Op guide.
Open live · Source code · GitHub
B-spline demo in Op guide.
Open live · Source code · GitHub
Nearest point demo in Op guide.
Open live · Source code · GitHub
Nearest point demo in Op guide.
Open live · Source code · GitHub
Intersection demo in Op guide.
Open live · Source code · GitHub
Perpendicular demo in Op guide.
Open live · Source code · GitHub
Angle demo in Pt guide.
Open live · Source code · GitHub
Demo in Pt guide.
Open live · Source code · GitHub
Demo in Pt guide.
Open live · Source code · GitHub
Demo in Pt guide.
Open live · Source code · GitHub
Frequency domain demo in Sound guide.
Open live · Source code · GitHub
Microphone demo in Sound guide.
Open live · Source code · GitHub
Sound play and analyze. Music snippet taken from Space Travel Clichés composed by MrGreenH
Open live · Source code · GitHub
Demo in Sound guide.
Open live · Source code · GitHub
A silly and elaborate character that responds to sound. Music snippet taken from Space Travel Clichés composed by MrGreenH
Open live · Source code · GitHub
Demo in Space guide.
Open live · Source code · GitHub
Demo in Tempo guide.
Open live · Source code · GitHub
Demo in Tempo guide.
Open live · Source code · GitHub
Progress demo in Tempo guide.
Open live · Source code · GitHub
Rhythm demo in Tempo guide.
Open live · Source code · GitHub
Shaping function demo in Tempo guide.
Open live · Source code · GitHub
Stagger demo in Tempo guide.
Open live · Source code · GitHub
Study of CanvasForm.font.
Open live · Source code · GitHub
Study of CanvasForm.image.
Open live · Source code · GitHub
Study of CanvasSpace.offscreen.
Open live · Source code · GitHub
Study of Circle.intersect2D.
Open live · Source code · GitHub
Study of Color.hsb.
Open live · Source code · GitHub
Study of Color.hsl.
Open live · Source code · GitHub
Study of Color.lab.
Open live · Source code · GitHub
Study of Color.lch.
Open live · Source code · GitHub
Study of Create.gridCells.
Open live · Source code · GitHub
Study of Curve.bspline.
Open live · Source code · GitHub
Study of Curve.interpolate.
Open live · Source code · GitHub
Study of Geom.sortEdges.
Open live · Source code · GitHub
Load an image and get its pixel
Open live · Source code · GitHub
Study of Line.intersect2D.
Open live · Source code · GitHub
Study of Line.marker.
Open live · Source code · GitHub
Path.crop uses the frontmost shape as a mask: the disc under the pointer. Only the faces of the star and the turning rectangle inside the disc remain, and the disc itself is discarded.
Open live · Source code · GitHub
Path.divide splits the shapes at every crossing into separate faces, each drawn in its own color. The star alone has six faces, since its center is enclosed twice.
Open live · Source code · GitHub
Path.exclude keeps the area inside an odd number of shapes, so every overlap becomes a hole. Drag the disc across the star and the turning rectangle.
Open live · Source code · GitHub
Path.intersect keeps only the area inside every shape. Drag the disc over where the star and the turning rectangle overlap to see the common area; anywhere else the result is empty.
Open live · Source code · GitHub
Path.minusBack subtracts the shapes behind from the frontmost one: the disc under the pointer minus the star and the turning rectangle. Drag the disc across them to carve it.
Open live · Source code · GitHub
Path.minusFront subtracts the shapes in front from the backmost one: here the turning rectangle and the disc are cut out of the star. Drag the disc inside the star to punch a hole.
Open live · Source code · GitHub
Path.unite merges every shape into one polygon: the area inside any of them. Move the pointer to drag the disc over the star and the turning rectangle; where nothing overlaps, the shapes stay separate rings.
Open live · Source code · GitHub
Study of Polygon.bisector.
Open live · Source code · GitHub
Study of Polygon.convexHull.
Open live · Source code · GitHub
Study of Polygon.intersect.
Open live · Source code · GitHub
Study of Polygon.midpoints.
Open live · Source code · GitHub
Study of Polygon.toRects.
Open live · Source code · GitHub
Study of Pt.op.
Open live · Source code · GitHub
Study of Rectangle.intersect2D.
Open live · Source code · GitHub
Study of Rectangle.quadrants.
Open live · Source code · GitHub
Study of Study.template.
Open live · Source code · GitHub
Study of Triangle.centers.