Many of the possible filter variables really reduce the number of samples available. At some point it becomes difficult to know if the data you are looking at is from a lot of independent studies with a small number of samples in each, or a tiny handful of studies with a large number of samples in each. Clearly the latter case is a more compelling dataset to draw conclusions from. Example below -
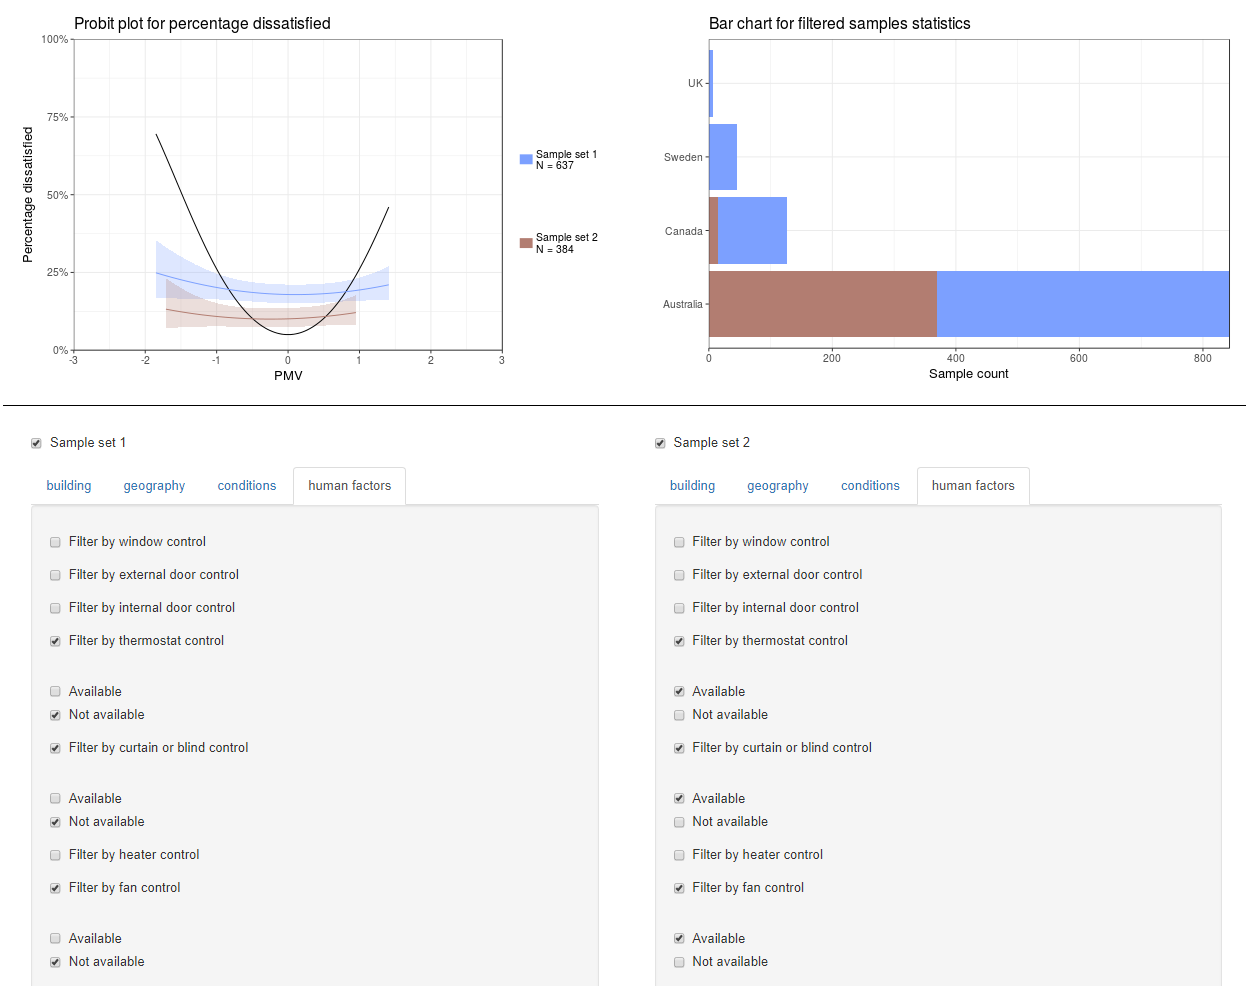
You can kind of infer from the countries that there are likely a limited number of studies here, but it would be good to make it explicit in the figures. One suggested way to do this is to also a 'N_studies', or small 'n', or some other term, to count the number of studies in each sample set, and add that under the existing N value. Or add it to the bar chart as a text annotation.
Many of the possible filter variables really reduce the number of samples available. At some point it becomes difficult to know if the data you are looking at is from a lot of independent studies with a small number of samples in each, or a tiny handful of studies with a large number of samples in each. Clearly the latter case is a more compelling dataset to draw conclusions from. Example below -
You can kind of infer from the countries that there are likely a limited number of studies here, but it would be good to make it explicit in the figures. One suggested way to do this is to also a 'N_studies', or small 'n', or some other term, to count the number of studies in each sample set, and add that under the existing N value. Or add it to the bar chart as a text annotation.